
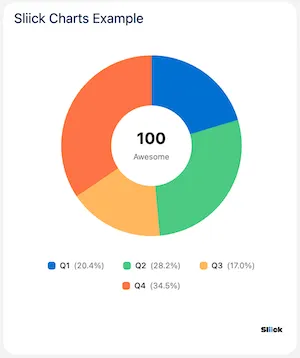
Sliick Charts: The Complete User Guide
Sliick Charts brings professional, high-performance data visualization directly to your Salesforce Lightning pages and Flows. Built with a Security-First mindset, Sliick Charts uses native SVG rendering to ensure 100% compliance with Lightning Web Security (LWS) without the need for external libraries like D3.js or Chart.js.
![]()
This guide provides everything you need to know to get started, from declarative setup to advanced developer integration.
📺 See it in Action
Check out our promotional video to see Sliick Charts in action:
Sliick Charts Promotional Video
🚀 Getting Started
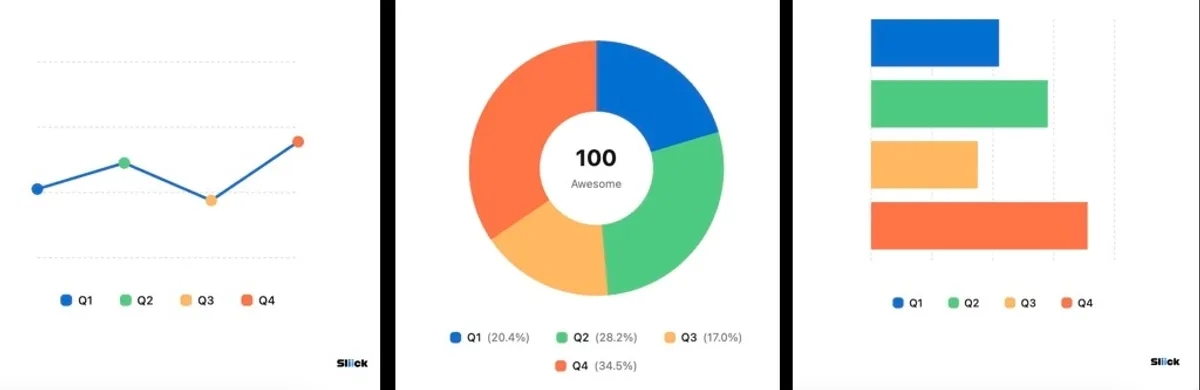
Sliick Charts supports six industry-standard chart types out of the box:
- Donut & Pie: Perfect for showing proportions and distributions.
- Bar & Column: Ideal for comparing records and tracking KPIs.
- Line & Area: The standard for tracking trends over time.
Prerequisites
- Install Sliick Charts on AppExchange
- Users configuring charts need the appropriate permissions to edit Lightning pages or Flow screens.
🎨 Using in Lightning App Builder
The easiest way to add a chart to a record or app page is via the Lightning App Builder.
- Navigate to the page you wish to edit and click the Setup Gear > Edit Page.
- Search for “Sliick Charts” in the component search box.
- Drag the component onto your canvas.
- Configure the properties in the right-hand panel.
Configuration Options
| Property | Description |
|---|---|
| Chart Type | Select the visual style (Donut, Pie, Bar, Column, Line, Area). |
| Chart Data (JSON) | Paste your data array in JSON format (see below). |
| Chart Size (px) | Set the width and height (Default: 300px). |
| Chart Title | An optional header displayed above the chart. |
| Hide Legend | Toggle the visibility of the color-coded guide. |
Data Format (JSON)
Sliick Charts expects a simple JSON array of objects. Each object must have a label and a value. You can optionally provide a color as a hex code, named color, or CSS function.
[
  { "label": "Q1 Sales", "value": 45000, "color": "#0070d2" },
  { "label": "Q2 Sales", "value": 62000, "color": "#4bca81" },
  { "label": "Q3 Sales", "value": 38000, "color": "#ffb75d" },
  { "label": "Q4 Sales", "value": 51000, "color": "#e96d63" }
]
🌊 Integration with Salesforce Flow
Sliick Charts is 100% compatible with Screen Flows, allowing you to build dynamic, data-driven wizards and guided processes.
- Open your flow in Flow Builder.
- Add a Screen element.
- Drag the Sliick Charts component onto the screen.
- Map your Flow variables (or formulas) to the component’s input properties.
[!TIP] Dynamic Data: Use a Flow Formula to construct the
Chart Data (JSON)string at runtime based on record data or user input.
💻 Developer Guide: Programmatic Usage
For developers building custom Lightning Web Components, Sliick Charts can be embedded directly in your templates.
Template Integration
<c-sliick-charts
  chart-type="line"
  chart-data="{myChartData}"
  chart-size="400"
  chart-title="Performance Trend"
>
</c-sliick-charts>
JavaScript Controller
import { LightningElement } from "lwc";

export default class RevenueDashboard extends LightningElement {
  myChartData = [
    { label: "Jan", value: 3200 },
    { label: "Feb", value: 4100 },
    { label: "Mar", value: 3800 },
  ];
}
🔒 Security & Architecture
Security isn’t an afterthought with Sliick Charts; it’s the core architecture.
Why Native Matters
Most charting libraries (D3, Chart.js) require significant DOM manipulation and access to global objects that are restricted by Lightning Web Security (LWS) and Locker Service. Sliick Charts bypasses these hurdles by:
- Zero Third-Party JS: No security exceptions or CSP trusted sites required.
- 100% Client-Side: No data ever leaves your Salesforce instance.
- SVG-Only: Logic calculates geometry, and LWC data binding handles the rest.
graph LR
    Data[Data Source] --> Logic[JS Geometry Engine]
    Logic --> Template[LWC Reactive Template]
    Template --> SVG[Native SVG Elements]
    SVG --> UI[Beautiful Charts]
    subgraph Security Boundary
    Logic
    Template
    SVG
    end
🛠 Troubleshooting & FAQ
Q: Why is my chart not rendering? Check your JSON syntax. Even a missing comma or quote can cause the component to fail parsing. We recommend using a validator like JSONLint.
Q: Are custom colors supported? Yes! You can provide any CSS-safe color value. If a value is deemed unsafe or invalid, the component will fall back to its internal accessible palette.
Q: Can I use this in Experience Cloud? Absolutely. Because it is a standard LWC, it works seamlessly in Experience Cloud (LWR and Aura sites).
Summary
Sliick Charts offers a powerful, secure, and lightweight alternative to heavy external charting libraries. By keeping everything native to the Salesforce platform, you ensure your dashboards remain fast, secure, and future-proof.
Ready to transform your data visualization? Install Sliick Charts on AppExchange today or explore the source on GitHub.